By now you should have already done all the hard work leading up to getting Google Analytics reports. That includes:
From blog 1
- Coming up with a measurement plan
- Preparing your website
From blog 2
- Adding Google Analytics code to your website pages
- Getting people to your website
Now, let’s dive into Google Analytics Reports and understand their meaning in relation to our goals and measurement plan. Keep in mind, there are a lot of reports that aren’t that helpful to a small business; so we’ll only be going over the important ones to help you deal with your measurement plan.
What do the Google Analytics Reports Mean
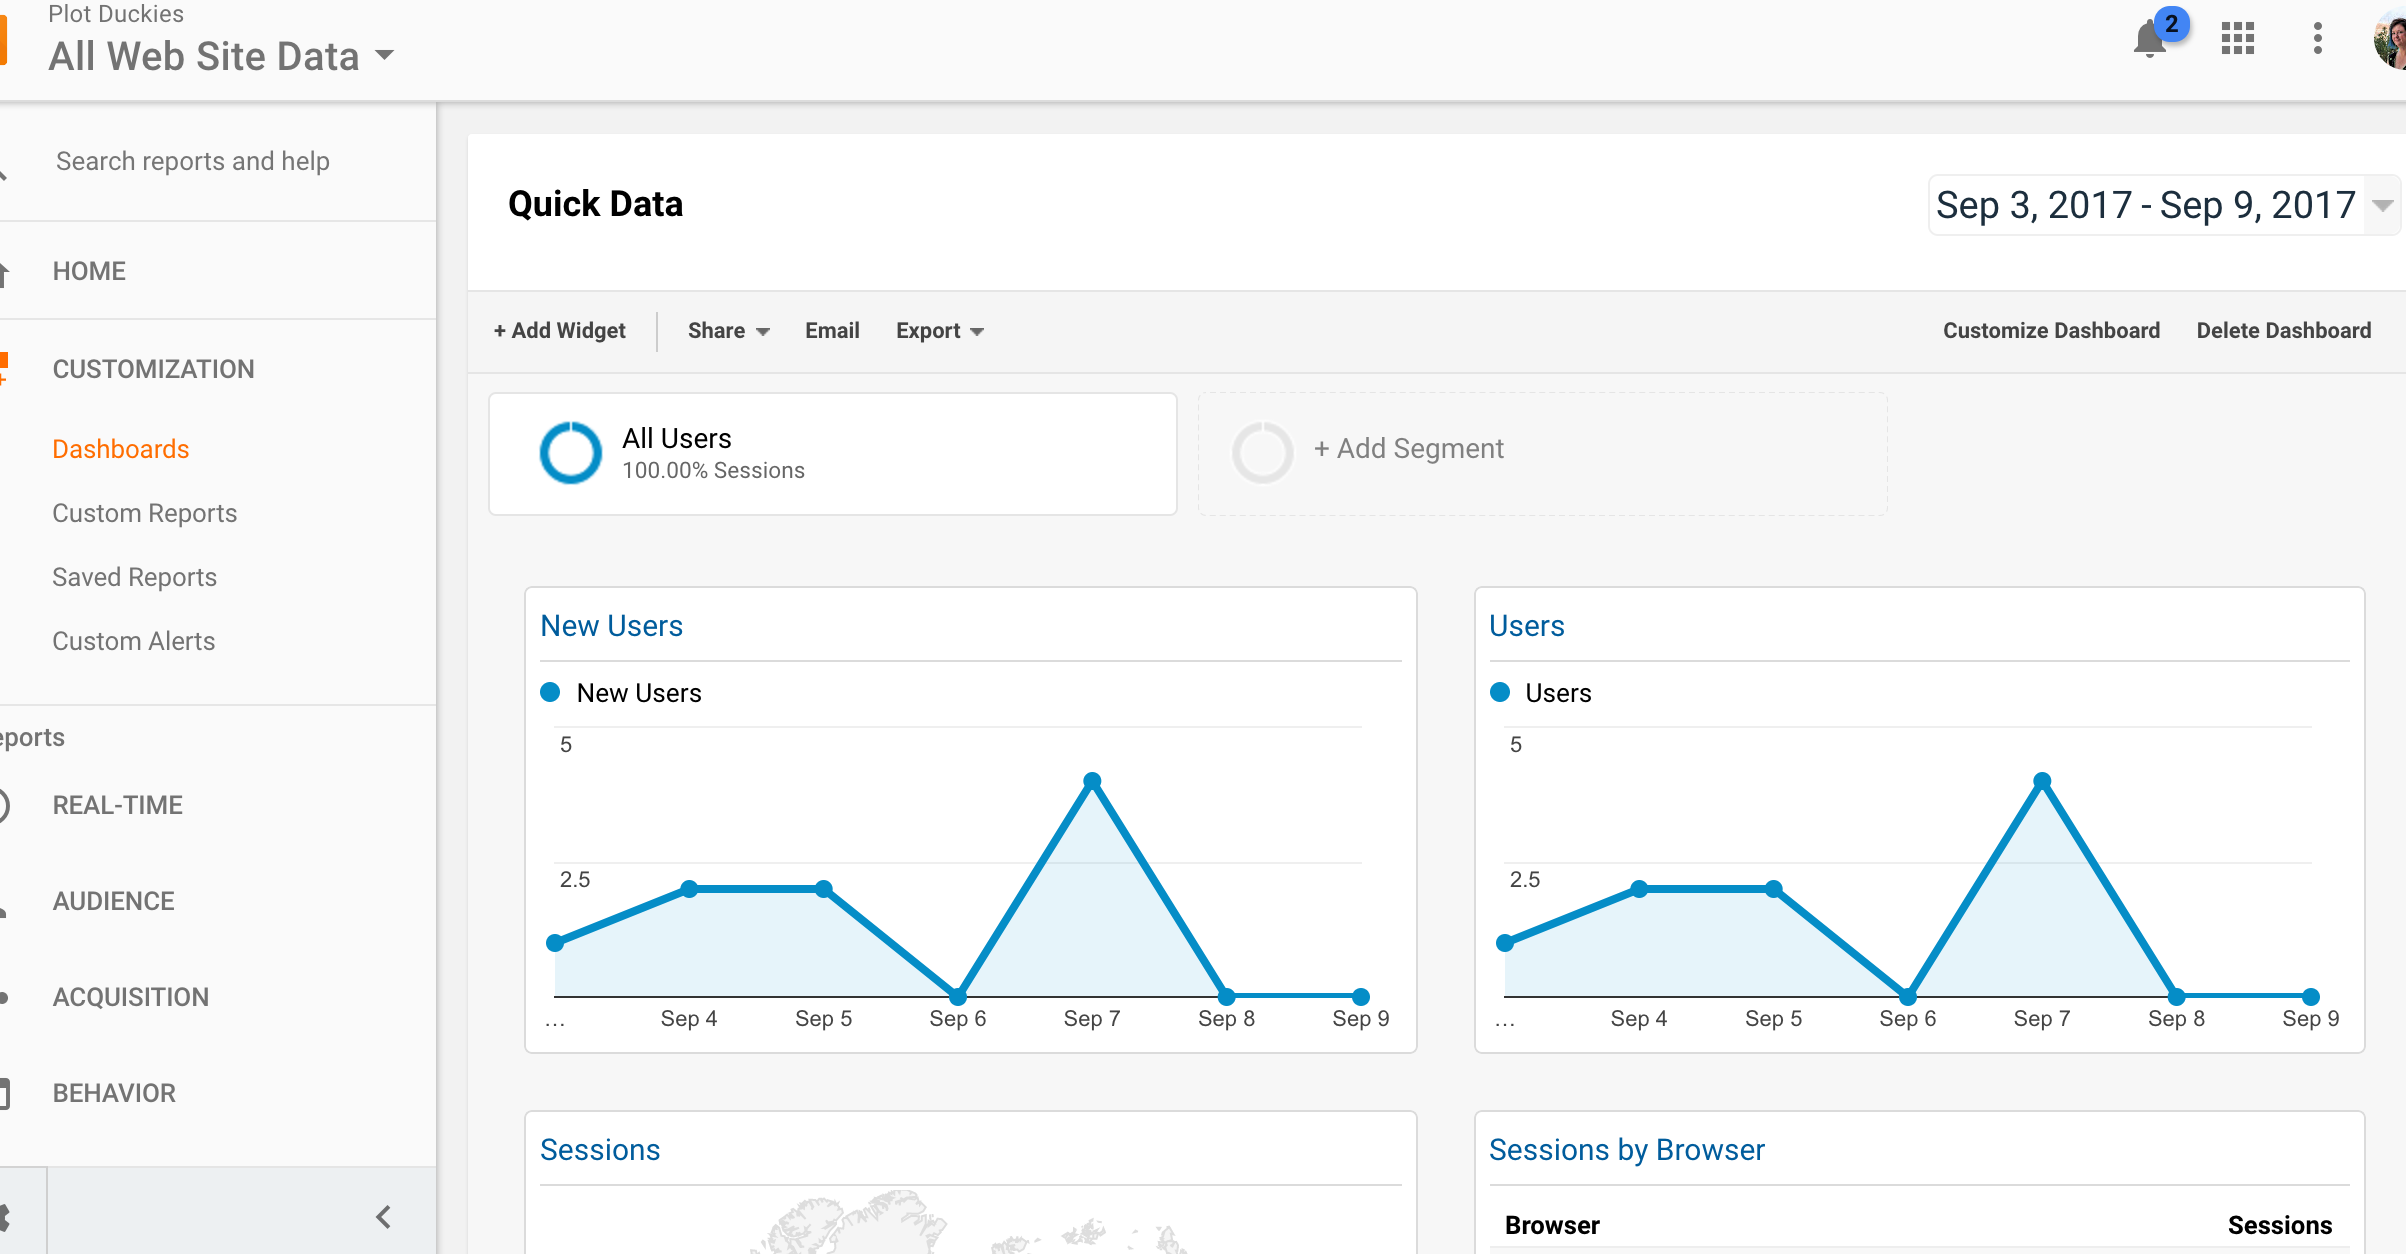
When you go into your Google Analytics page you see:
- Which account you’re on. If you want to change the account, click on the drop down arrow and select the web site data you want to see.
- Navigation for your reports
- Some quick data on your web pages
- Some real time data on your website (in this case I’m currently on my website so it’s counting me as a current visitor.)
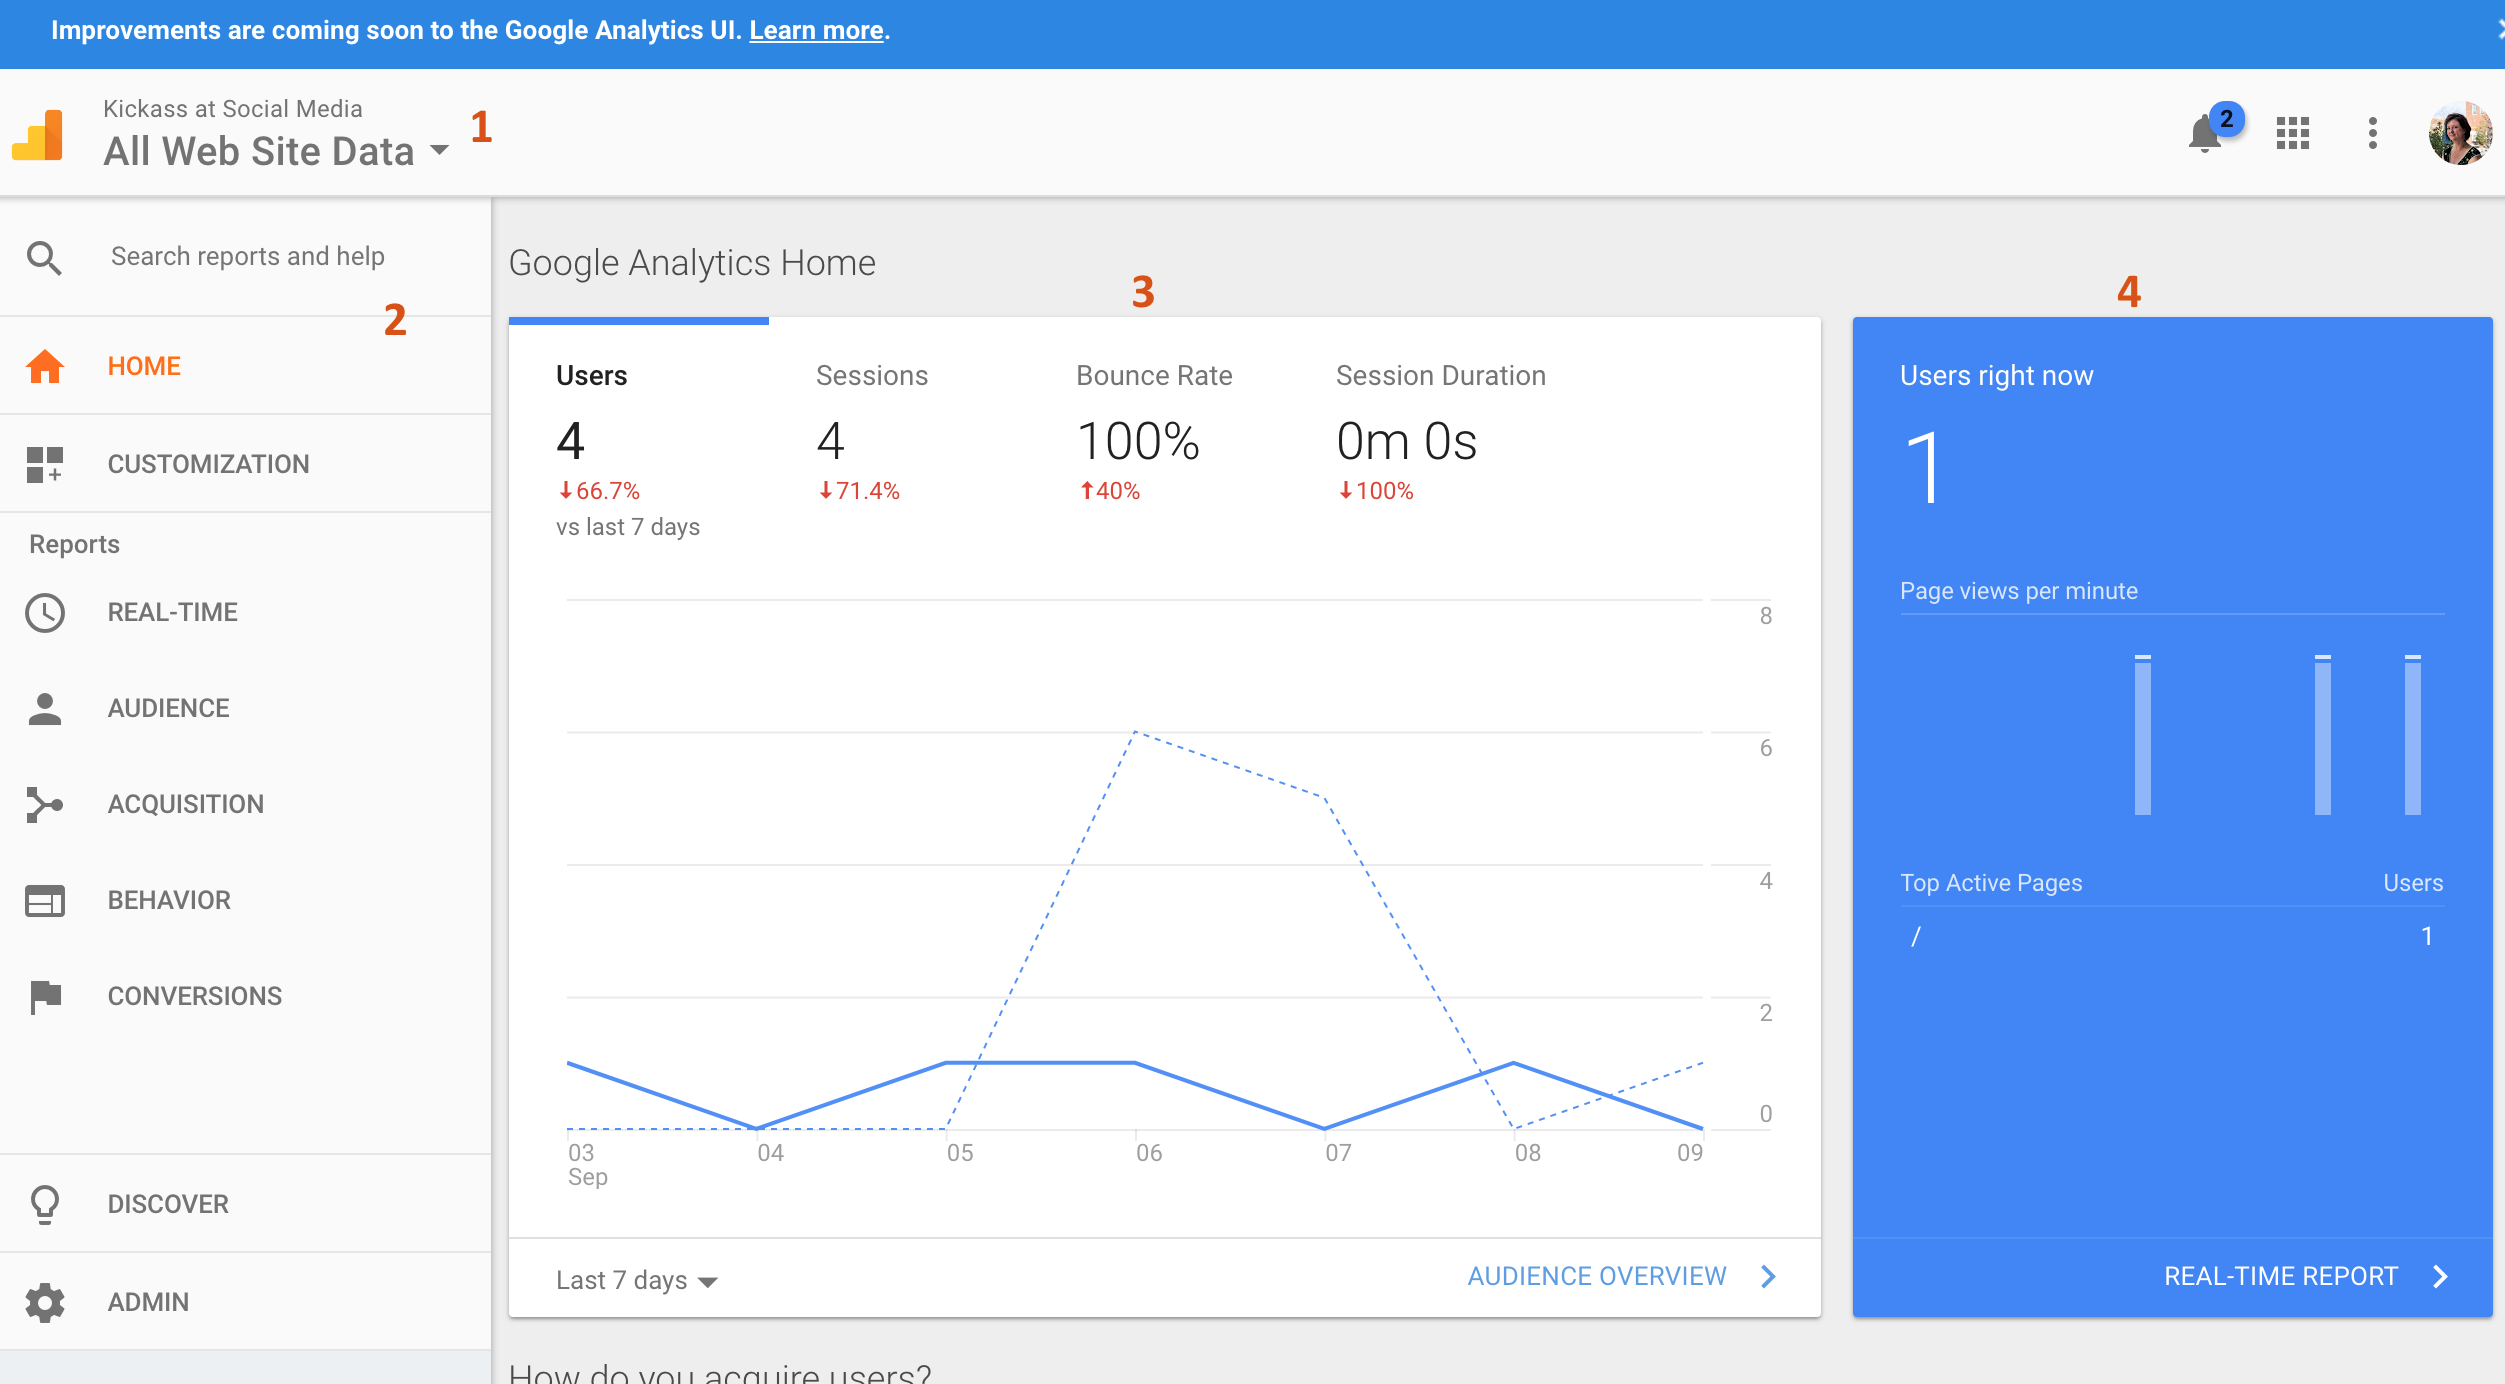 Let’s talk a little about the data we’re seeing in 3. Google has put these numbers together to help us quickly understand how things have gone for the last seven days for your website.
In this example, I’m using Kickass at Social Media data.
- Users – Showing us that there were 9 users in the last 7 days. I.e. 9 individuals went to this website.
- Sessions – Showing us that there were 9 sessions in the last 7 days. “Sessions” refer to each unique time someone visited the website. If this number were 10 or more, it would mean that the same person (one of the 9 that visited in the last 7 days) visited your website more than once.
- Bounce Rate – This number refers to the percentage of users that clicked away from your page right away. (We’ll get more into that later in this blog)
- Session Duration – How much time people spent on your website.
Now, let’s take a closer look at each of the navigation choices that are relevant to your small business. This blog won’t be going over every navigation choice because a lot of them aren’t relevant.
Audience
The Audience report section dives into details about the people visiting our website. To give you some different data, I’ve used SonjaDewing.com as the example here.
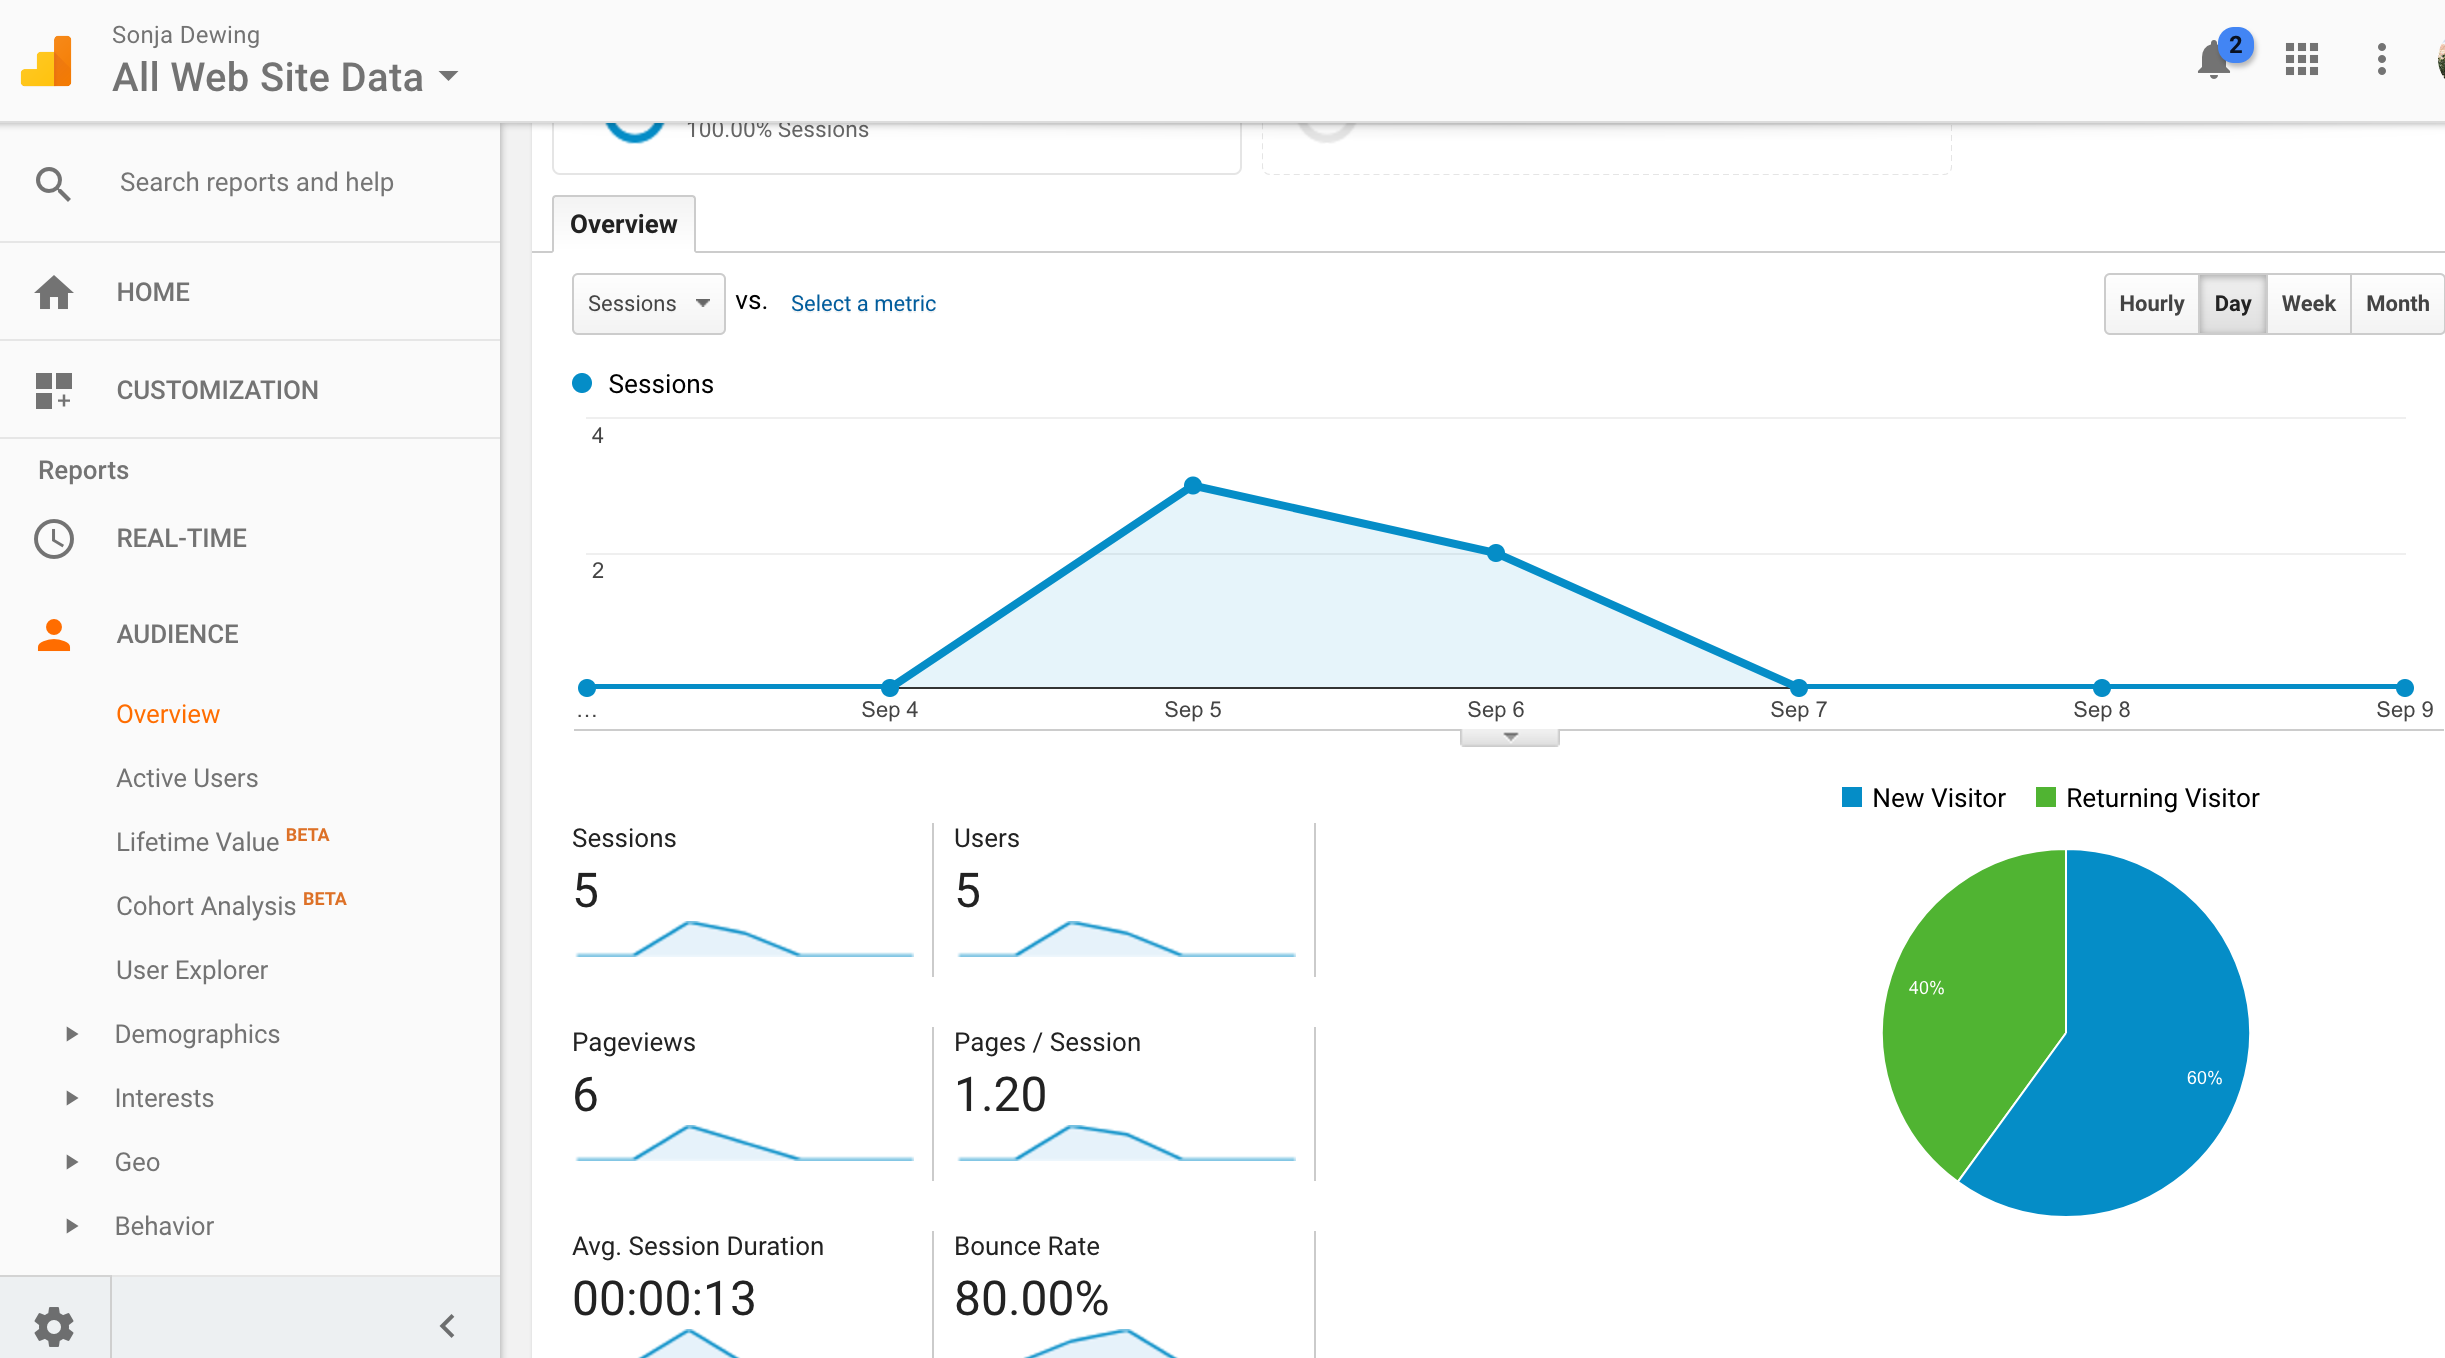
The most important details here are:
Overview: The same info as you’ll see on home. What’s different here is the graphic to show you New Visitors versus Returning Visitors. This means that people are coming back to the website after they’ve already visited – it could be to read a blog, find your contact information, etc.
Bounce rate: Here again we have information on bounce rate. Bounce rate basically means that when people visited the website, they didn’t find anything interesting enough to keep them there. There can be a lot of reasons that this is happening, including:
- Did they get to your website by accident?
- Is there a reference to your website somewhere that doesn’t make sense (i.e. a blog about recycling has a link to your website about animal shelters so visitors don’t find it useful.)
- Did it take too long for your website to load?
- Is your website working on the user’s browser?
- Do you have any content that would keep a visitor on your website (like a blog, an event schedule, etc.)
How important is bounce rate? It depends on the goal for your website. If your goal for your website is to have people sign up for your newsletter, users may be going on, signing up for your newsletter, then closing the site right away. So bounce rate wouldn’t be that important – as long as you’re getting newsletter sign-ups.
A good goal for bounce rate is anywhere between 20-40%, average is 41-55%.
If you want to fix your bounce rate, work on those things you can control, such as:
- Loading speed. If users have to wait for a website to load, they will more than likely close it and go somewhere else. In that case, look to reduce image sizes in order to increase loading speed. {link to previous wordpress plugin with resizers},
- Browsers load your website correctly. Users come from a variety of browsers like Chrome, Firefox, and Internet Explorer. Have you checked to see that your website looks right in all those browsers?
- Creating content that keeps users on longer. This content can be anything from blogs to an image gallery.
Technology/Browser: What’s interesting here is you can scroll down and click on “Browser” you get a quick view of the types of browsers people are using to view your website. This is important when we talk about bounce rate.
If 95% of your users are using Chrome, definitely test your website from Chrome to make sure it looks and works right.
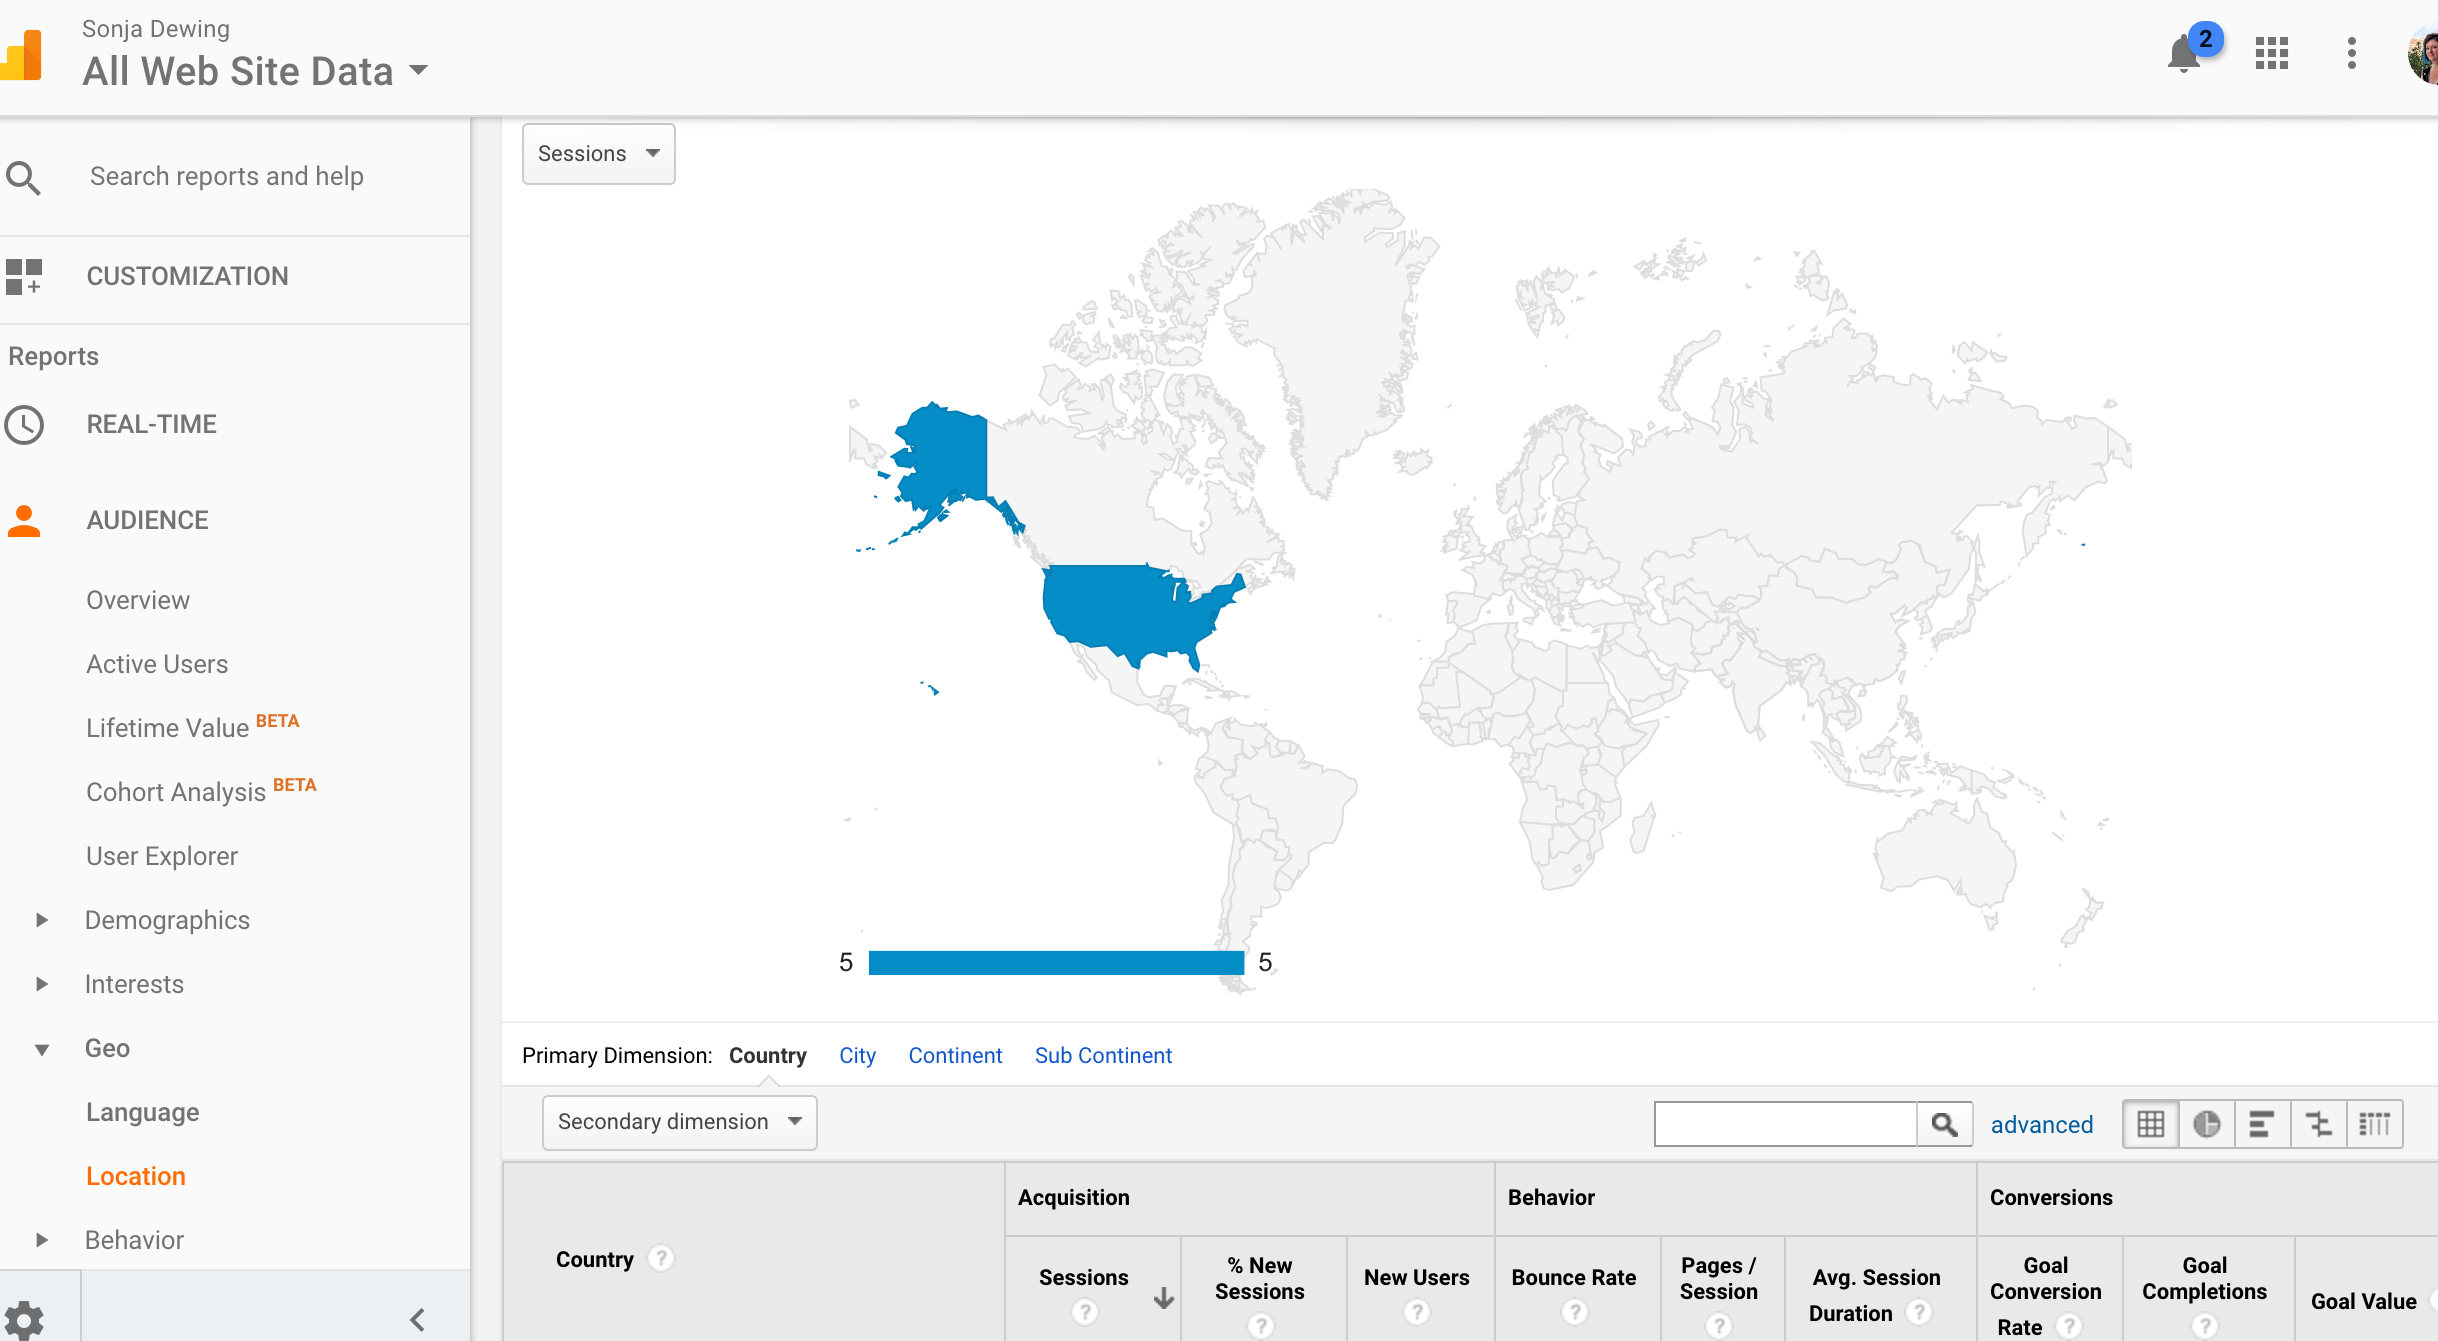
Geo/Location: Is another bit of Audience that can be important. If you’re focused on an audience in your local area, and people are coming to your website from far away, you might want to create more content that talks about your local area, whether that’s blogs or more information on your contact page.
If you want to explore this information in more detail, you can click on the blue areas of the map and dive down into states, etc.
Mobile/Overview: This information is important if you haven’t made your site mobile friendly. If you have a lot of people accessing your site via mobile, you should make sure that it works for a mobile environment.
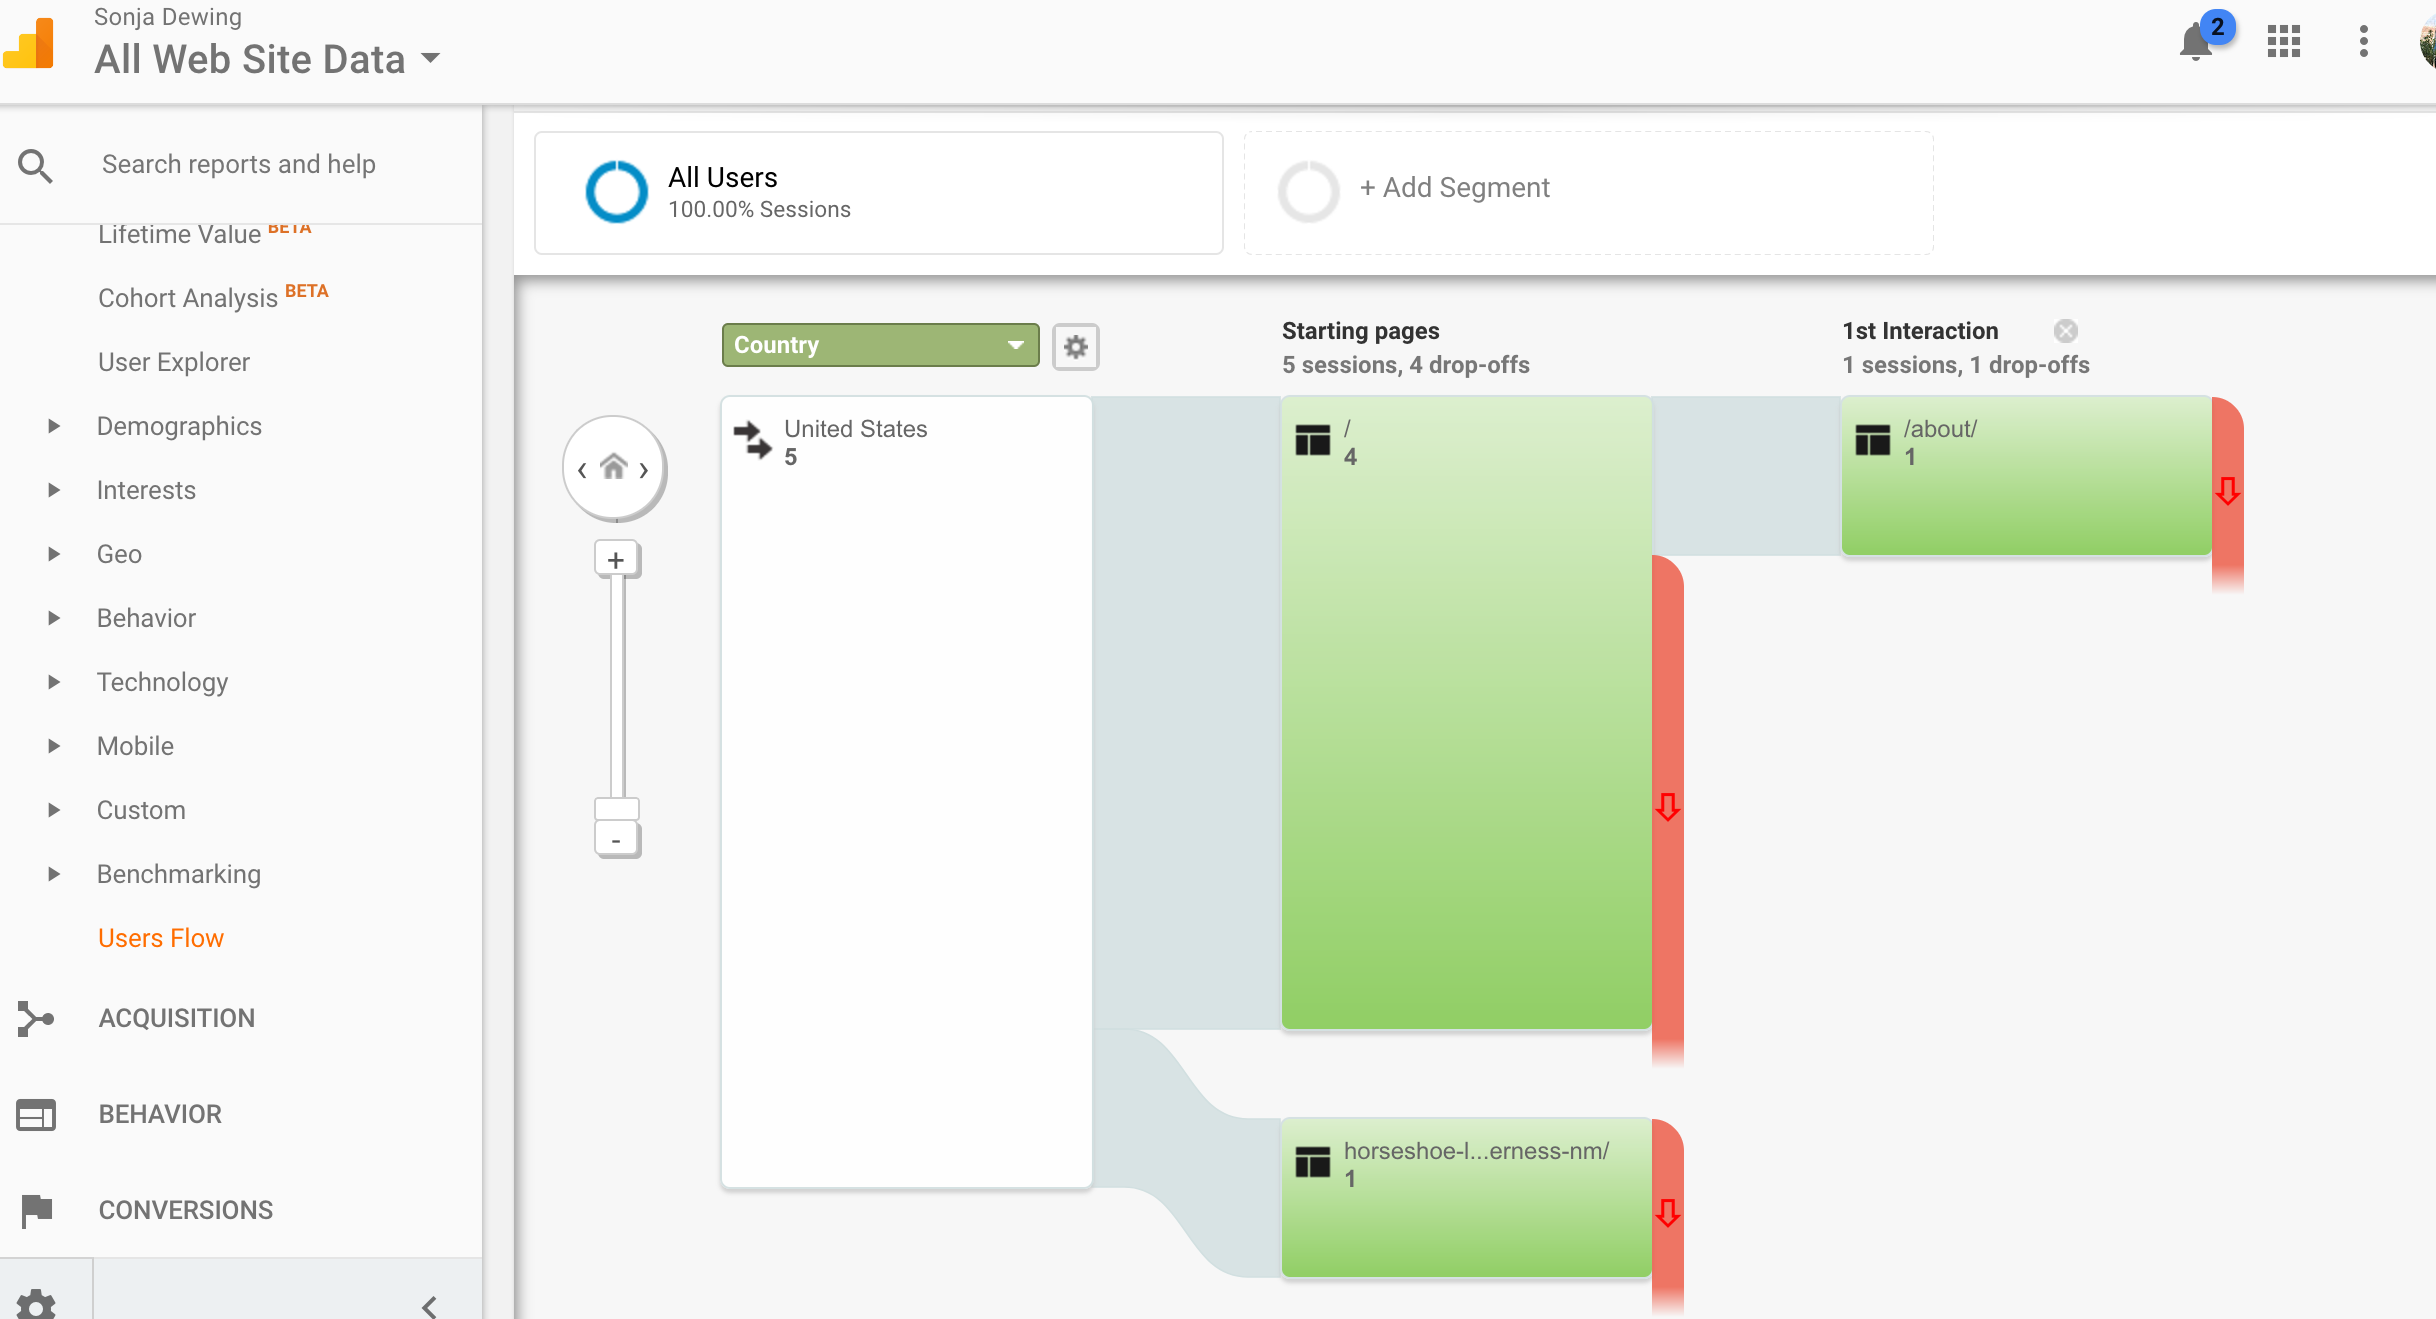
Users Flow: Very important if you want users to go to a certain page. For example, here we see that 4 people went direct to the home page, only one 1 went to the “About” page. 1 person went directly to a blog post about Horseshoe Lake.
If I wanted people to end up on a certain page, I’d change things up on my home page. Ie. Put a large link to my blogs, or other page information.
Acquisition
How are people finding your website?

Overview: The overview is going to show how people are finding your website.
An organic find means that they found your website through another website that linked to yours, an ad, or a search on a browser like Google.
A direct search means that they knew your website address and typed it into their web address.
What does this mean to you? It’s great to have organic traffic, especially if that traffic is coming from searches – meaning their finding your information through your search engine optimization (SEO).
Source/Medium: Going to Source/Medium will show you where those organic searches are coming from.
What about the rest? Truthfully, there’s not much more you need to take a look at for a small business measurement plan.
Make improvements in your website based on reports and your plan
Specifically, let’s talk about your measurement plan.
Examples that I used in blog 1
- Plot Duckies. This company is focused on working and helping writers throughout the United States be more creative.

Their website business goals are:
- Increase brand awareness by sharing useful information on the website, getting increased traffic to the website by the end of the year.You can see that there is traffic (9 in the last 7 days) but a high bounce rate. In this case, this is more than likely because of using the website as an example in these blogs. You are not the target market for the website so you leave quickly.What I would do to fix a high bounce rate: 1. Start adding more helpful blogs for the target market. 2. Start sharing those blogs on social media to get visitors to the website. 3. Explore any other reasons that the bounce rate is high (as mentioned above in bounce rate).Each time I make a change to the website, blogs, etc. I’d come back here to see if my visitor numbers are up, bounce rate is down, and check under Behavior to see if Audience/Users Flow is going where I want it. Make small changes each time to see how your numbers change in relation to the updates.
- Increase brand awareness by 50 new email/newsletter signups by the end of the month.
This number you wouldn’t need from Google Analytics, you’d see that from the number of sign-ups. But if you aren’t getting any sign-ups directly from your website, which you’d know from looking at your newsletter sign-ups, you’d want to make access to your sign-up page easy to find.
- Kickass at Social Media. This company is focused on teaching social media to Albuquerque small businesses. Their website business goal:
- Increase revenue by selling more tickets to the next event in September.The revenue number is going to come from ticket sales, but if you are getting a lot of bounce rate, that means no one is taking time to read about your event. In this case, I would write some blogs around the event (the event space, the event presenters, lessons learned from the last event, the city the event is in, etc.) This way it increases the SEO, and gets people on the site a little longer.
Creating a Customized Dashboard
If you’re going into Google Analytics and only need certain information, it’s helpful to create a dashboard.
Google already has a starter dashboard that’s really helpful to put everything together.
- Click on Customization
- Click on Dashboards
- Click on Create

As you can see from the image above, Google gives you an option to start with a blank dashboard, or start with a Starter Dashboard. The Starter Dashboard is actually very helpful.
- Click on Starter Dashboard
- Type in a name for your new Dashboard (I used Quick View)
- Click on Create Dashboard
Now you have data grouped onto one page that’s very useful. To change any of the data, select the edit button above the widget (a widget is a reference to each graphic piece of data on the page). To remove any widget, you can select the close button on the upper right of each graphic.
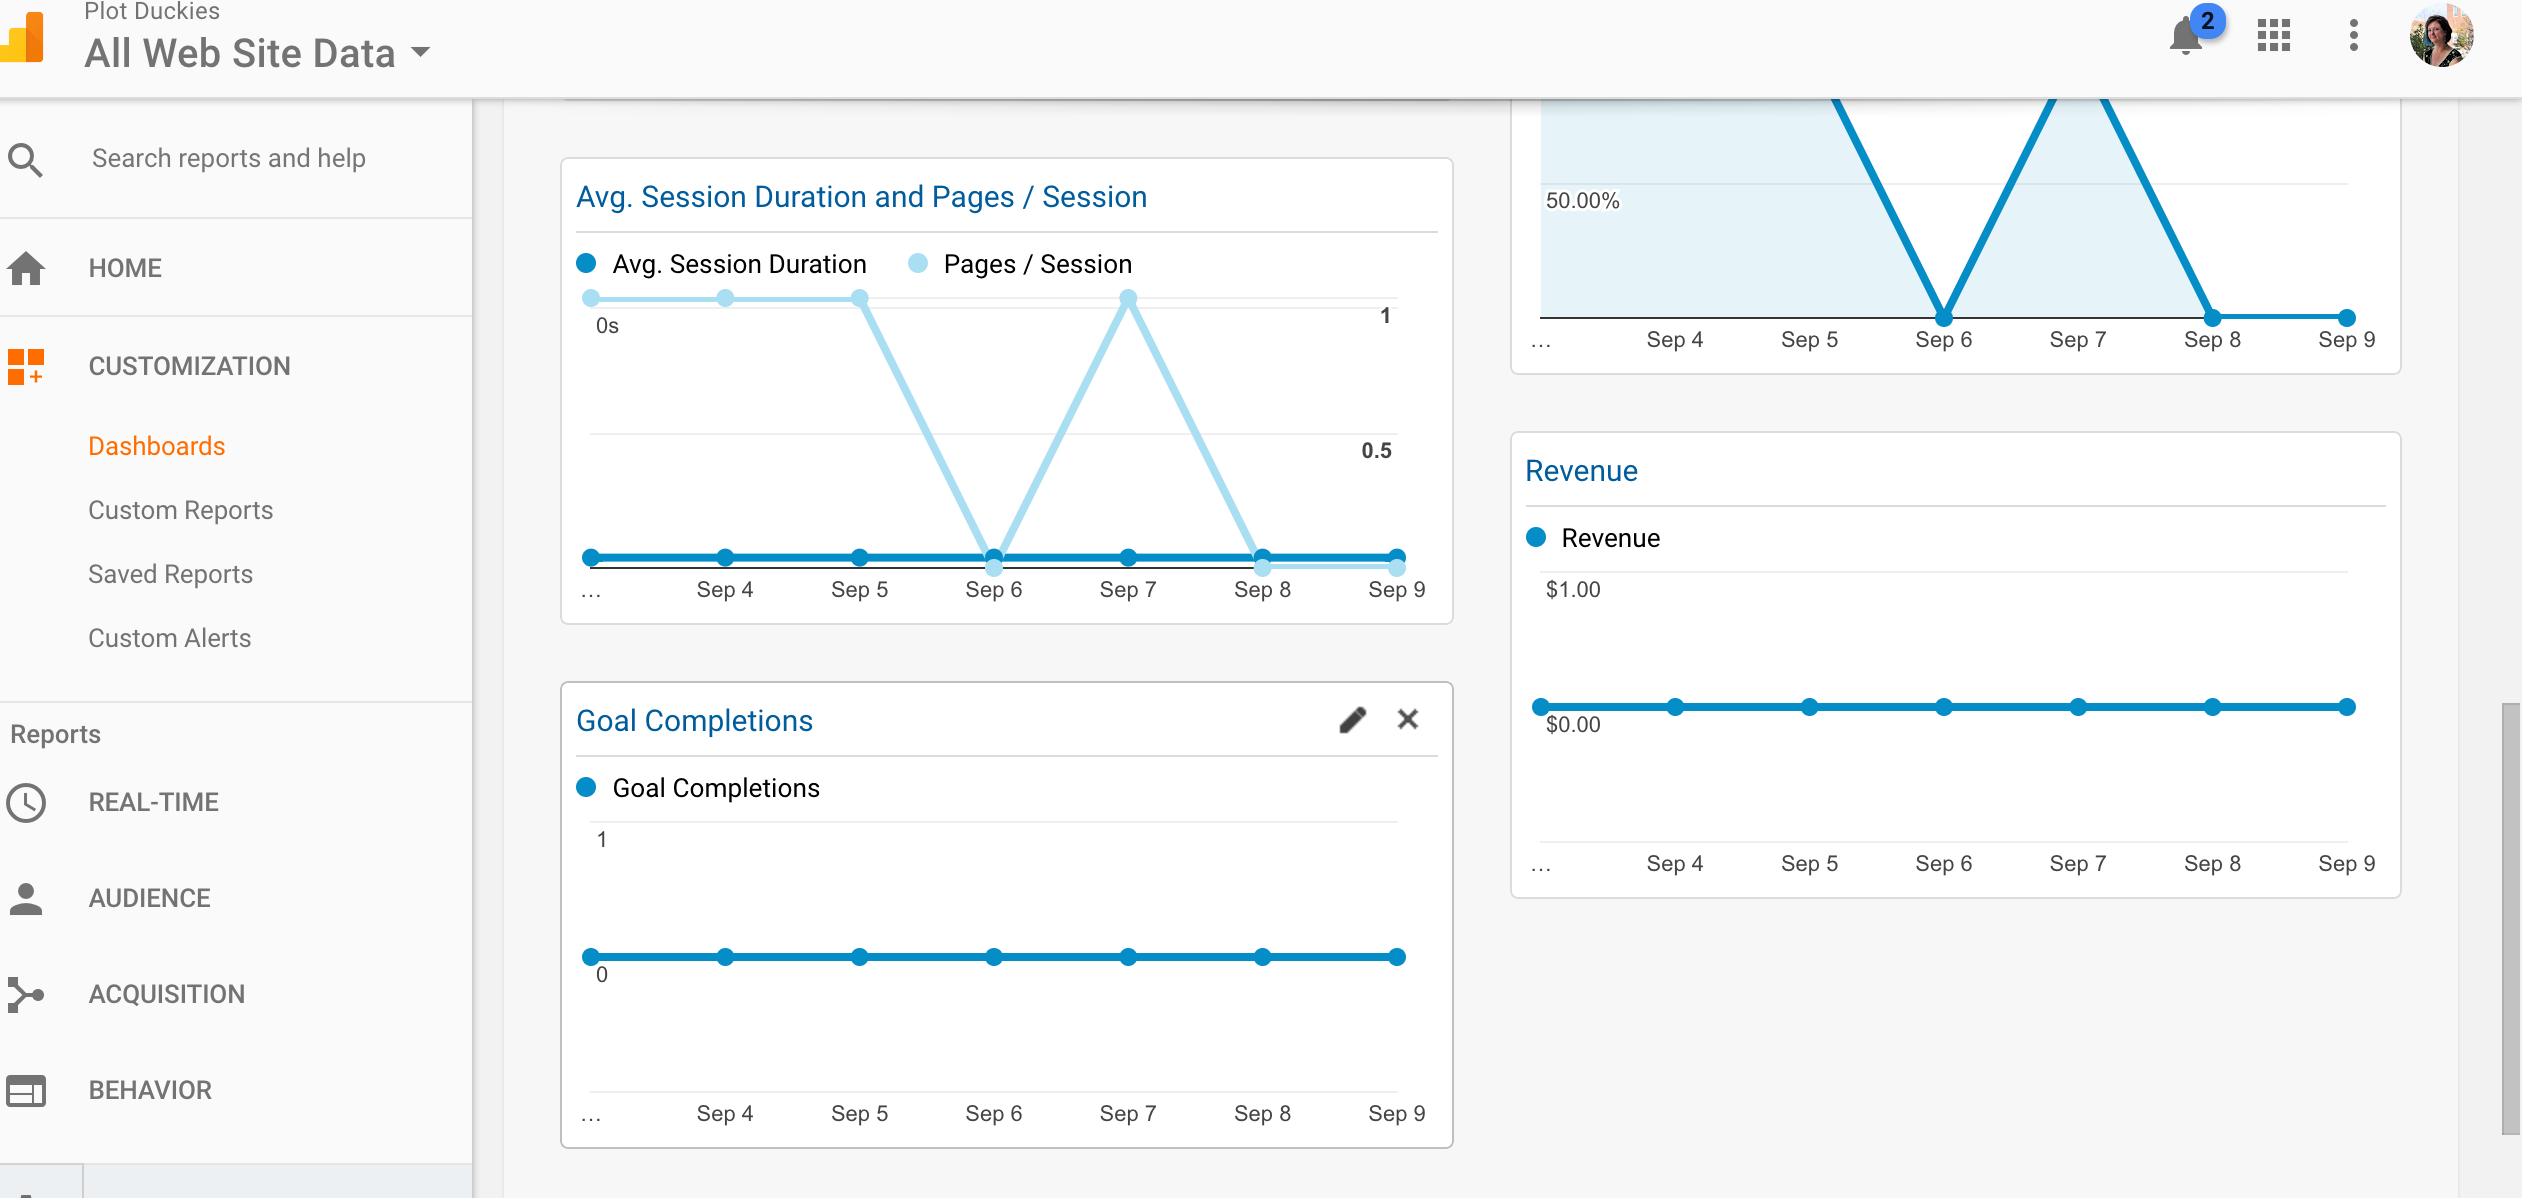
In this case, I’m going to scroll down and delete the widgets for Goals and Revenue because this information isn’t important.
If you want to add a new widget, on the upper left of the page, select + Add Widget. This will give you a dialogue box where you can select any of the widgets available. However, I’m not going to add anything because this is already giving me the information I need to see at a glance.
Plus, those things that I would want to add, like organic/direct searches, I can’t add to the dashboard. So, I’ll have to click on that information to see the data.
At one time there was a way to go to a report and add it to your dashboard, but since Google Analytics is going through some changes, that isn’t currently available.
And, that’s it for Google Analytics. It’s pretty simple when you get to know the reports. Keep an eye on that data, and remember to record what you do. Good luck on your measurement plan!
Other resources you may be interested in

Sonja D.
As in instructor at the University of New Mexico Continuing Education, Sonja Dewing has been working with small businesses for over ten years on their social media, blogging, marketing and website plans.

Amar T.
Amar is the president and co-founder of AmDee. He has been an industry leader in accessibility compliance—auditing and remediating websites, publishing articles, delivering presentations to national audiences, and training content editors and developers in accessibility best practices.
You May Also Like
Having a website is an absolute necessity for any business. Gone are the days when you could simply update your website once and forget about it for months on end. In today’s ever-changing digital landscape it is important to constantly track and measure how well your website performs, as well…
read more >
Thomas Bertram (T. Bert) Lance famously said, "If it ain't broke, don't fix it." Unfortunately, T. Bert Lance couldn’t foresee the future. He didn’t know that over 94% of Americans would be on the internet by 2024. If your website doesn't receive periodic updates or isn't accessible, users can become…
read more >