Having a website is an absolute necessity for any business. Gone are the days when you could simply update your website once and forget about it for months on end. In today’s ever-changing digital landscape it is important to constantly track and measure how well your website performs, as well as make changes to continue achieving your goals.
There are a number of factors that can affect website performance. Quite often they are interconnected making it hard to distinguish which one is failing or contributing to your business goals. The good news is there is one thing that encompasses all aspects of customer interaction with the website, products and services. User experience (UX).
Measuring user experience does not mean you will have answers to all of your questions, but improving UX will solve some of your marketing problems.
The number one question you are now likely asking yourself. How do I go about measuring the UX of my website?
Before we get into that, did you know that 88% of online customers are less likely to return to a website after having a bad experience? That’s significant!
Understanding your UX metrics are important to make sure your website not only meets your business goals but also provides excellent customer experience.
So, where do you start?
Start with setting your goals
A common mistake in UX measurement is to start defining the metrics without setting goals first. Tracking certain metrics just because you can or just for the sake of measuring something doesn’t make sense.
Think top-bottom when defining your UX metrics.
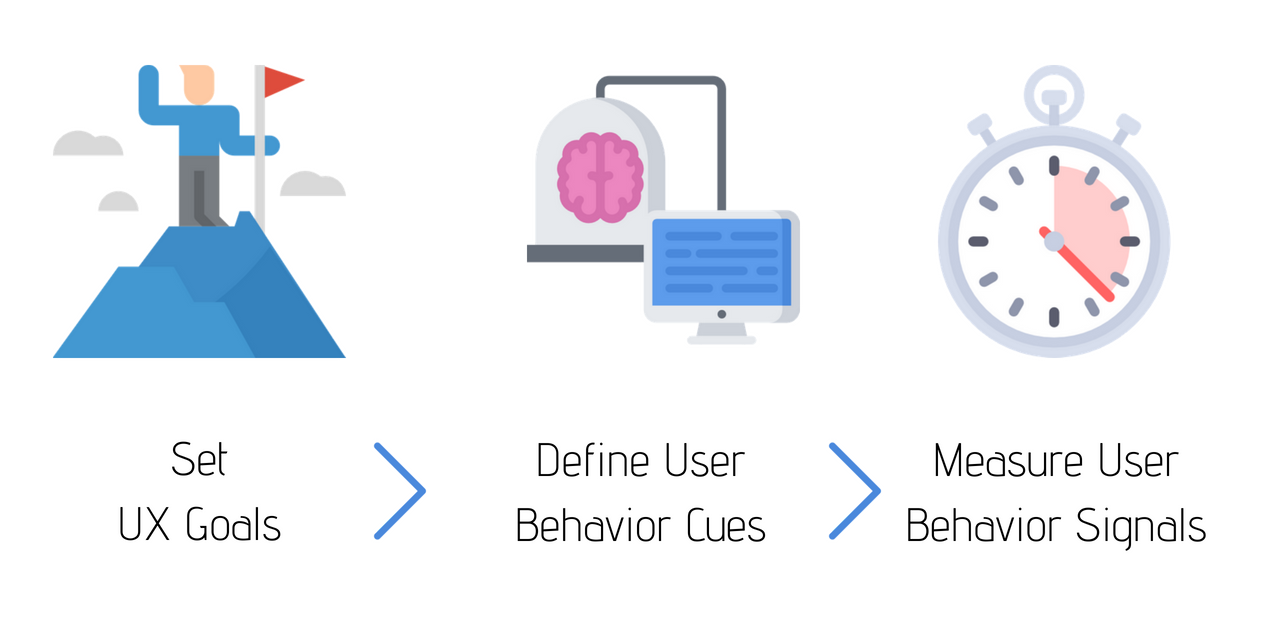
Consider the overall user experience you want to deliver. Avoid setting goals like increasing time-on-site as a measure of engagement. Instead, focus on what you want users to achieve on your site. A strong UX goal is ensuring content is useful and guides users to actions (e.g., browsing another page, downloading an ebook). Identify user behaviors that signal success, like reading to the page’s bottom or downloading content. Once you know your goals and signals, you can determine how to measure these behaviors.
Choosing the right metrics
Analytics tools offer vast amounts of data but don’t directly provide UX insights. Metrics like conversion rate, bounce rate, time on site, and visits to purchase are important but lack context and are hard to link to usability and UX elements.
They answer the “what” but give no information about the “why”.
The example of a low bounce rate might seem positive, but it can indicate users are either frustrated and struggling to find what they need or they found what they need and are browsing related content. Analytics alone can’t fully measure UX; it’s best to use analytics data to support and validate user testing results.
Measuring UX with User Testing
User testing is an effective way to assess website UX by observing real users’ interactions and collecting their feedback. It provides valuable qualitative and quantitative data. During testing, users complete tasks while observers record their behavior and reactions. This process helps identify usability issues and gauge overall user satisfaction, leading to actionable insights for improving the website.
The most common UX metrics to measure

Success Rate
User success rate measures the percentage of tasks users complete successfully. It’s simple to collect and highly insightful. Users often complete tasks partially, so assigning partial success can be useful. If users frequently fail to complete typical tasks, identify and address the issues causing these failures before proceeding.
How do you calculate user success rate?
You can calculate the user success rate with a simple formula. Suppose you tested 5 users on 10 tasks each. If 30 tasks were completed successfully, 5 were partially successful, and 15 failed, the formula is:
(successful tasks + 0.5 * partially successful tasks) / total tasks.
For this example: (30 + 0.5 * 5) / 50 = 65%.
Typically, most websites score below 50% on this metric, indicating user frustration rather than satisfaction, according to Nielsen Norman Group.
Time on task
A good user experience is one that is efficient for the user. The time on task metric measures just that. It shows how much time it takes the user to complete each task.
Depending on the number of users participating in the test, you can calculate the time on task metric as the geometric mean or the sample median of all user results. Typically, the geometric mean tends to be more accurate for smaller samples (fewer than 25 participants) and the mean works better for large scale studies.
Error rate
This metric helps explain why users spend more time on certain tasks and offers powerful insights when paired with the time-on-task metric.
The error rate indicates how often users make errors while completing tasks. It’s important to differentiate between slips and mistakes. Slips, such as typos or selecting the wrong month for a reservation, are unintentional errors not related to interface design. Mistakes occur when users misunderstand the interface, like clicking non-clickable elements or entering incorrect information.
Users can make multiple errors per task, complicating the error rate calculation. Instead of deriving a simple percentage, you should:
- Track the number of errors per task to identify where errors occur most frequently.
- Calculate the percentage of errors for each task versus the total number of errors.
These methods help pinpoint tasks with the most user pain points.
Subjective satisfaction
Users might complete all tasks successfully with a 100% success rate and no errors, yet still not feel satisfied with the user experience. This is where the subjective satisfaction metric is important.
While users generally prefer websites with higher usability metrics, satisfaction is not always directly correlated with usability. In fact, 30% of the time, users may prefer websites with below-average usability.
Therefore, it’s essential to measure user preference alongside other usability metrics. Here’s how:
After completing all tasks, ask users to fill out a brief satisfaction questionnaire, which can be as simple as a single question: “On a scale of 1–10, how satisfied are you with using this website?” The average score from this question will provide an understanding of users’ subjective satisfaction with your website.
Final thoughts
Measuring user experience helps you understand how well your website performs in terms of sales, marketing, and user satisfaction. By tracking the right metrics, you can evaluate your website’s user experience and ensure it aligns with your broader business goals.
This blog was updated on July 9, 2024.

Amar T.
Amar is the president and co-founder of AmDee. He has been an industry leader in accessibility compliance—auditing and remediating websites, publishing articles, delivering presentations to national audiences, and training content editors and developers in accessibility best practices.
You May Also Like

Thomas Bertram (T. Bert) Lance famously said, "If it ain't broke, don't fix it." Unfortunately, T. Bert Lance couldn’t foresee the future. He didn’t know that over 94% of Americans would be on the internet by 2024. If your website doesn't receive periodic updates or isn't accessible, users can become…
read more >
The average American now spends over half of their day staring at a screen. A recent Nielsen report reveals that adults in the United States spend over 12 hours a day on digital devices. This includes time spent using apps, browsing the web on smartphones, streaming services, and using desktop…
read more >