3 Google Analytics Tools You May Be Overlooking
In 2015, Marketing Land reported that nearly 30 million to 50 million people used Google Analytics. to track their web usage. For almost a decade, Google Analytics has been a staple in any content marketers arsenal. But, with a such a dynamic tool, it can be easy to overlook some of its features. Below, we’ve outlined a few Google Analytics capabilities that you may have overlooked.
A Urchin Tracking Module (UTM) Code is code added to a link that gives Google Analytics information about an URL. Each code can tell you where your traffic is coming from, broken down by channel, campaign and more. If you’re running a social media campaign to attract more donors for your nonprofit, UTM codes may be a great way to track where your efforts are best sent. Below is an example from Degordian of a UTM code that show which social media posts are bringing traffic to a website.
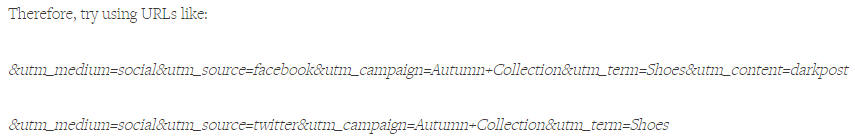
UTM Medium is how your content appears within Google Analytics. In the aforementioned hypothetical social media campaign, the content from a social media platform brought donors to a fundraising page (could also be a blog, an ad, search results, etc).
UTM Source is where your content appears on the internet. This code indicates which specific platform is bringing traffic (i.e Facebook, Twitter, LinkedIn, newsletters, etc).
UTM Campaign is the name of your campaign or tagwords for your content.
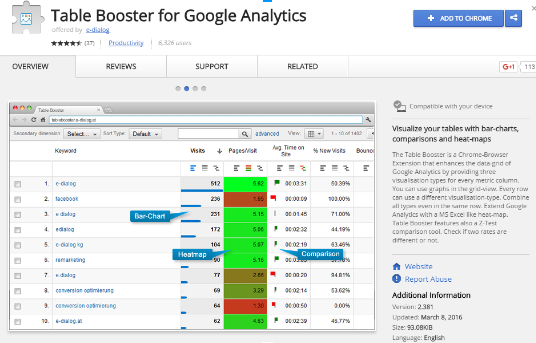
Table Booster is a Google Chrome extension. It enhances the data grid of Google Analytics by providing three visual aids for every metric column. This is a great tool for visual learners. When Google Analytics presents numbers to you in a chart this extension can turn it into a heat map, bar chart, or a comparison.
Content Experiments is a feature available within the Google Analytics program. This tool helps you conduct experiments on your website before publishing actual changes. Google developers offers a step-by-step tutorial of how this would work for a travel agency deciding which image leads their users to book a trip. It lets you create separate variable pages, conduct your experiment to gather results, and then make a confident prediction on how the changes will go. This is also a helpful tool to use when presenting data to a Board of Directors, fellow employees, or potential clients. The numbers don’t lie, so let them do the talking for you!
Which Google Analytics tool is your best friend? Let us know in the comments below or tweet us @amdeellc!

Amar T.
Amar is the president and co-founder of AmDee. He has been an industry leader in accessibility compliance—auditing and remediating websites, publishing articles, delivering presentations to national audiences, and training content editors and developers in accessibility best practices.
You May Also Like
Having a website is an absolute necessity for any business. Gone are the days when you could simply update your website once and forget about it for months on end. In today’s ever-changing digital landscape it is important to constantly track and measure how well your website performs, as well…
read more >
Thomas Bertram (T. Bert) Lance famously said, "If it ain't broke, don't fix it." Unfortunately, T. Bert Lance couldn’t foresee the future. He didn’t know that over 94% of Americans would be on the internet by 2024. If your website doesn't receive periodic updates or isn't accessible, users can become…
read more >